Graphing

Overview
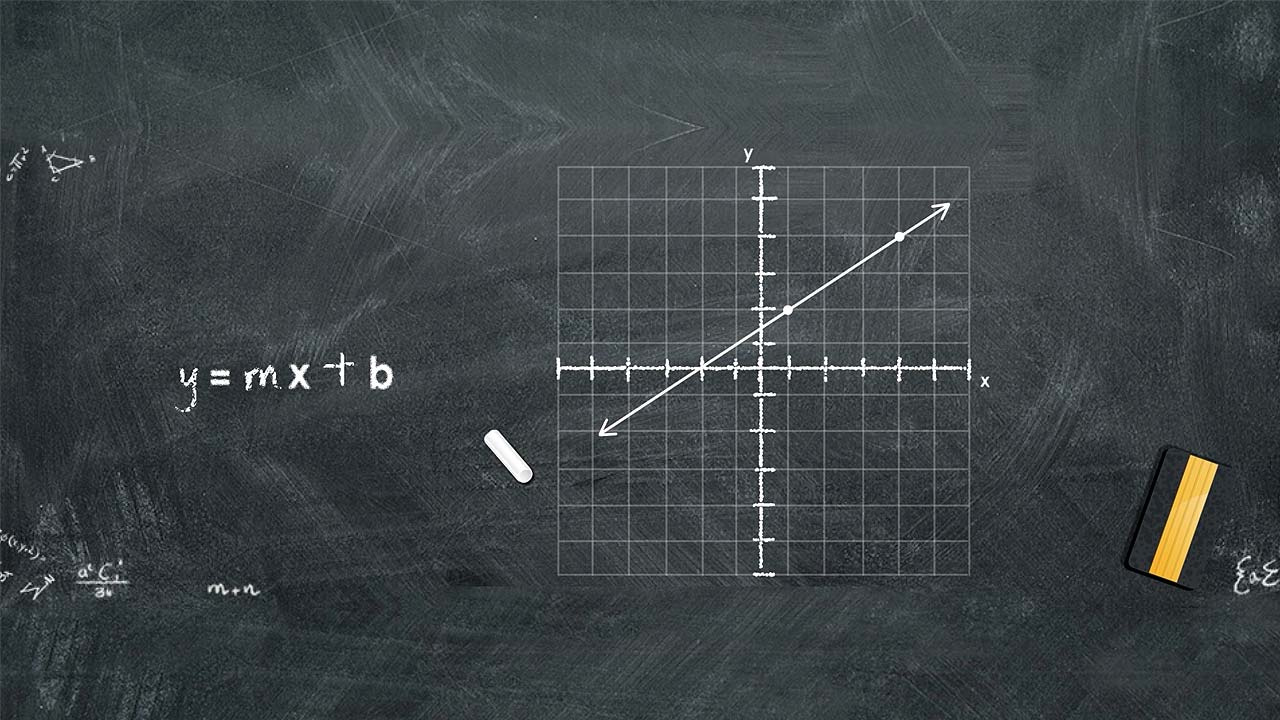
In science, we use equations as a tool for showing a relationship between two or more entities. Using equations allows us to create a graphic of those relationships. This graphic is known as a graph and the importance of graphing cannot be overstated. Graphs are used as a tool to observe correlations between various experimental parameters.
Learning Objectives
Upon completion of this exercise, you will be able to:
- Recognize the purpose of graphing lines
- Describe how to find the slope of a line
- Explain the equation of a line
- Perform basic calculations to find the slope and intercepts
Related
eLearning
Documentation is a critical part of any manufacturing process. Every manufacturing step is... more
eLearning
Explore the basics of pH by using the pH scale, learning how to adjust pH, and examining the... more
eLearning
Learn the five basic concepts of creating a safe and productive lab environment. You will explore... more
eLearning
Are you interested in a career in biotechnology or manufacturing? This short interactive... more
- 1 of 7
- >